 Log In


"I need an estimate, now!" Using Deltek's new Vision Fee Estimate Tool


If you have worked for a professional services firm for more than a week, I’m sure you’ve heard the words, “I need an estimate, now!” And, you probably played a part in the ensuing fire drill to pull together the estimate for a proposal that always seems to show up on a Friday afternoon as you are contemplating your weekend agenda. The result is a frantic, big league swag to get a number submitted, even though you didn’t have time to check with everyone on the numbers.
With the release of Vision 7.4, you can now create Fee Estimates quickly and easily to support your proposal for any opportunity. In order to do this, you need to set up models or “service profiles” in advance that match the scope of work you are bidding. For this post, I will focus on the “Fee Structure” of a Service Profile. First, let’s review how to enable the Fee Estimate tool in Vision 7.4:
Step 1: Turn on the tool by going to Configuration/Opportunity Settings/Fee Estimate tab.
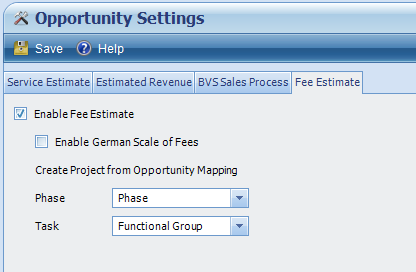
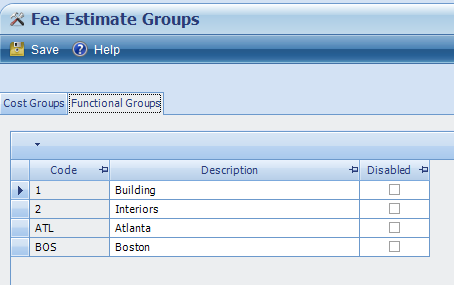
Step 2: Configure the Fee Estimate Tool. This is where you will need to do some homework on the best possible way to create Fee Estimates for your firm. To start, you will need to define group categories called “Cost Group” and “Functional Group.”
- In Vision terms, think of the Functional Group as a WBS level
- Cost groups roll up to one Functional Group
Step 3: Define your “Service Profile” – Now that you have the Fee Estimate tool enabled and you have the basis for your work breakdown structure defined (Cost Groups and Functional Groups), it is time to dig into the best way to structure each Fee Estimate “Service Profile” or model. A Service Profile is made up of the following components:
- Fee Structure – (General Tab of the Service Profile)
- Phases – (Phases Tab of the Service Profile)
- Work Breakdown Structure – (Functional and Cost Groups Tabs of the Service Profile)
- Access – (Company Access Tab of the Service Profile)
Fee Basis
As I said before, for the purpose of this post, I’m going to focus on the very important Fee Structure. To determine the Fee Structure for you estimating model, you will need to start by determining the Fee Basis. Think of Fee Basis as the unit in which you will build your estimate. Again, we are looking for a quick way to pull together an order of magnitude estimate based on sound historical data. So, you will need to analyze a common unit across past projects that would be a good indicator of total effort. For some companies, this might be…
- The number of drawings issued
- The number of walls erected
- The number of samples taken
- The total installed cost of the project or construction cost
And remember, you can have as many “Service Profiles” as needed to cover the different types of projects you execute. You just need to determine the common predictor for that type of project.
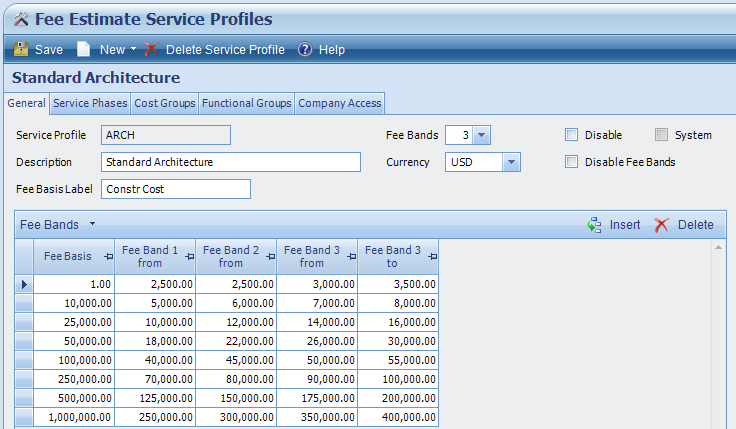
Fee Bands
Once you have the Fee Basis determined, the next step is to determine the complexity levels for a given service profile (Fee Bands). In its simplest form, think of this as “Easy, Average and Complex” with the easiest or least complex on the left moving to the right as the complexity increases. Having these bands will allow the estimator to identify the Fee Basis quantity, let’s say samples taken, and then factor in complexity. For example, the complexity changes for a sample taken on a remote hill-side vs. a flat residential lot. Choose the number of fee bands that gives you the best range of complexity for the type of project.
Fee Table
Now that we have the Fee Basis and Fee Bands defined, we need to look back at historical projects and begin to categorize each project to determine complexity and actual fee per fee basis. For example, I look back at each of my soil testing projects and notice that for a simple eight sample core test, our firm has charged $1,000 and our profit margin has been 25%. And, as we have increased the number of tests per project, the cost per sample decreases, thus the fee per total sample decreases. Now you will start to paint a picture that will allow you to build ranges (rows in the fee estimate grid) that help you correlate Fee Basis to Fee.
Create rows in the Fee table that best cover the specific scope of work. If 80% of work for this scope falls between 10 and 100 samples (Fee Basis), you could probably insert rows as follows:
- 1 – 10 samples
- 25
- 50
- 75
- 100
- 150
- 250
- 500
Creating an Opportunity Fee Estimate
Now that you have built your Fee Basis, Fee Bands and filled in the corresponding Fee Table, you are ready to use this Service Profile to create opportunity estimates. To create a new Opportunity Fee Estimate, you will select the appropriate Service Profile and then enter the Fee Basis amount for each Functional Group. You can enter the details at the Cost Group level and that will sum to the Functional Group.
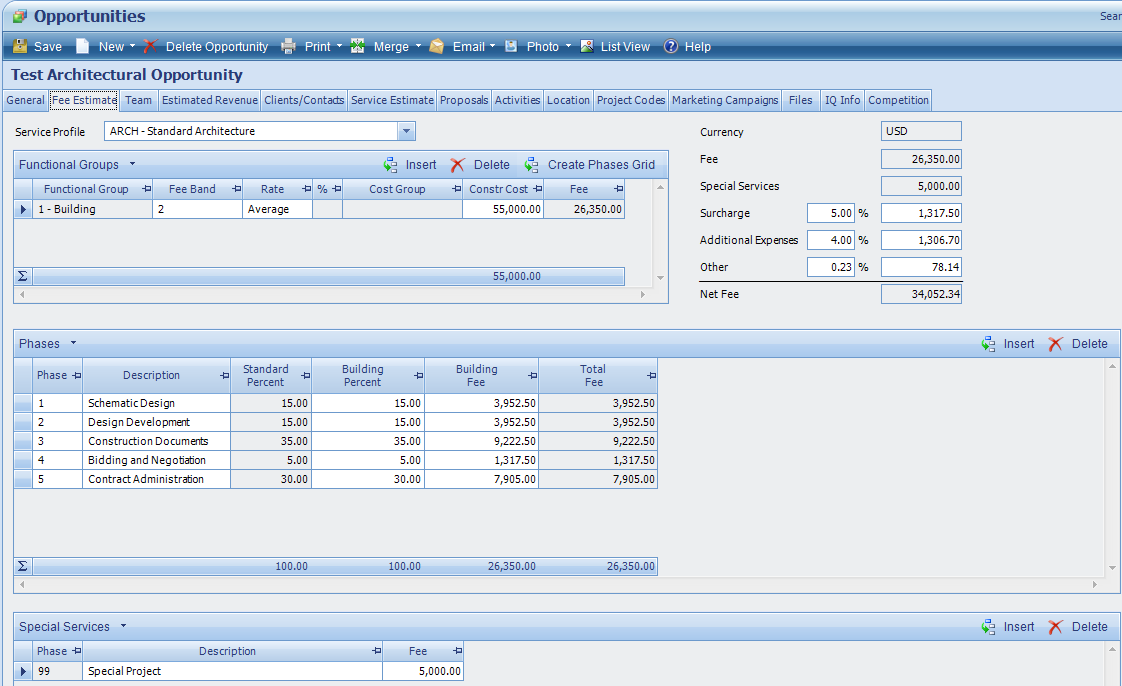
In this example, the Fee Basis is Construction Cost. We have received an RFP for a small architectural package and the estimated construction cost is $55,000. Now we need to determine our Fee. Keeping with this example, I create the Fee Estimate by inserting the proper functional group row, select the Fee Band (Complexity) as level 2 (just under average as I’ve defined in my Service Profile), entered the Fee Basis Construction Cost of $55,000. Now Vision will calculate the firm’s fee based on interpolation between the $50,000 and $100,000 row in the Service Profile. Based on this calculation, the resulting fee for this example is $26,350.
Summary
Take the time to research the results of historical projects so you can utilize this data to quickly and profitably estimate future projects using Vision new Fee Estimate tool. The effort alone will give you great insight across the department or firm into the financial make-up of projects at varying sizes and complexity.
Deltek Project Nation Newsletter
Subscribe to receive the latest news and best practices across a range of relevant topics and industries.


