 Log In


Deliver Greater Insight with Simple Modifications to Vantagepoint CRM & Business Development Dashboards


At Deltek’s most recent ProjectCon conference, I delivered a session on Deltek Vantagepoint CRM & Business Development (BD) dashboards. In the session, attendees learned tips and tricks for adjusting copies of the pre-defined CRM and BD dashboards available in Vantagepoint. By making a few minor dashboard adjustments, users can uncover BD insights for the entire company, specific business units, single departments or individual team members.
In this post, you will learn about the pre-defined dashboards available in Vantagepoint CRM and learn what simple modifications you can use to create more impactful dashboards for your teams. Be sure to check out the future CRM Dashboards blog post that will dig in to how you can use calculated fields and more to take your CRM dashboards to the next level.
Deltek Vantagepoint CRM
Not using Vantagepoint CRM yet? Learn about the benefits today.
CRM & Business Development Pre-Defined Dashboards
Before considering what dashboards your firm may want for CRM or BD information, spend some time exploring and working with the pre-defined dashboards already available. These are the three that are focused on CRM and business development:
When reviewing the pre-defined dashboards, consider the following:
- What dashparts work for your firm and the data you currently capture?
- Is there something different you’d like to see? Are you capturing the data to see or use it on a dashpart?
- You may find you can rearrange or combine different dashparts onto a new dashboard to better fit your needs or that you want to build your own dashparts.
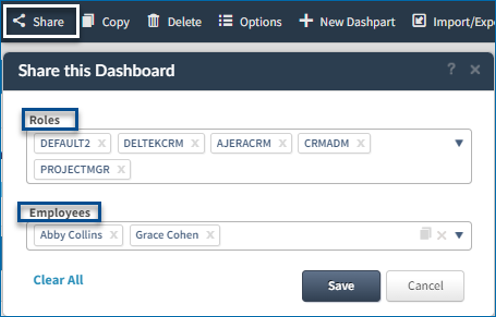
If you do not have access to the pre-defined dashboards, your System Administrator can share them with your role or with you individually.
5 Simple Modifications to Create Meaningful Dashparts
A few modifications to copies of the pre-defined dashparts may be all you need to get the targeted information. Here are a few examples of adjustments that can be done to dashboards and dashparts:
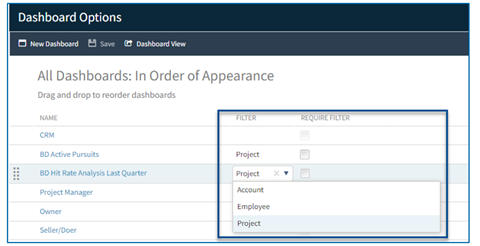
#1 Add Dashboard Filters
The first suggestion is to set a dashboard filter for the BD Active Pursuits and BD Hit Rate Analysis Dashboards. This will make these dashboards more flexible for different groups within the organization. Dashboard filters are set in Options (available when editing a dashboard). Set the filter to Project.
The dashboard filter applies to all the dashparts based on the dashboard record selection. Use it to filter the dashboard to a specific group within the organization, to your own pursuits, or to a specific set of records based on ad-hoc search.
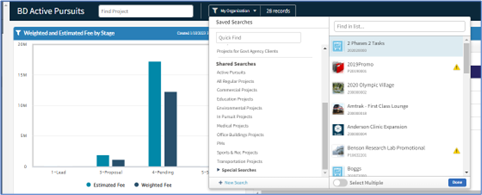
To clear the dashboard filter and return the dashboard back to its original state, just select “All” in the dashboard filter. The dashboard also resets if you navigate away from it and come back again.
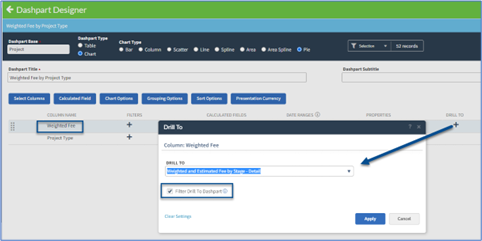
#2 Use “Drill-To” Dashparts
Use “Drill To” feature to go from summary data to detail data or from detail to summary data or even detail to detail or summary to summary.
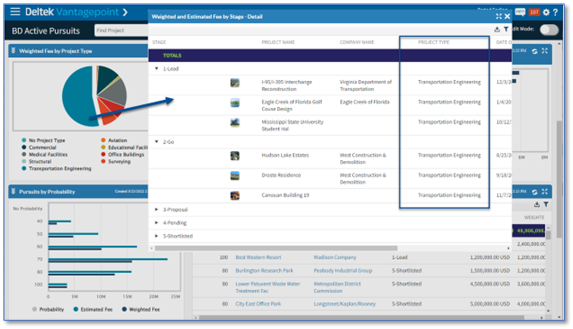
Any column on a dashpart can be set to drill to another dashpart. Drill To dashparts can be filtered based on the specific segment the user wants to drill into, or it can be set to show default data it is configured to display.
For these next few changes, the best-practice recommendation is to copy the existing pre-defined dashparts before making modifications to them. To make a copy, just edit the dashpart you want to start with and click Copy. Administrators often go back to pre-defined dashparts for reference as they create new dashparts, so it is good to keep them intact.
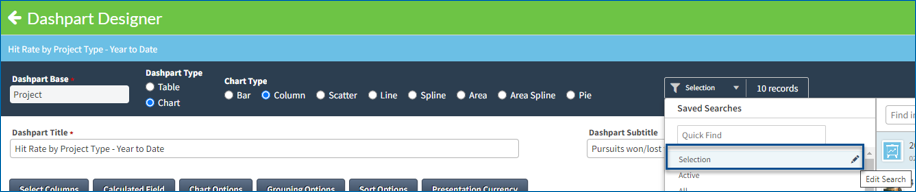
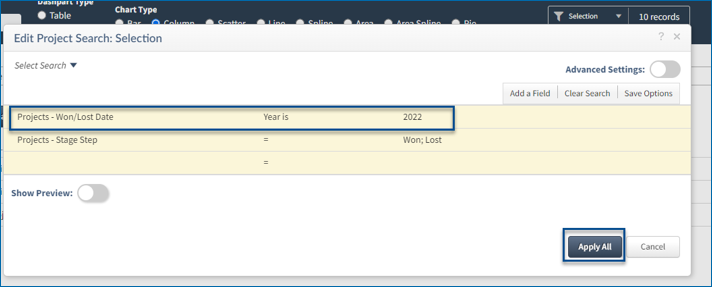
#3 Add or Adjust Dashpart Filters
Changing a dashpart filter helps focus the dashpart on the data your firm is interested in. For example, the dashparts on BD Hit Rate Analysis dashboard are focused on last quarter. You might want to change them to see the entire year.
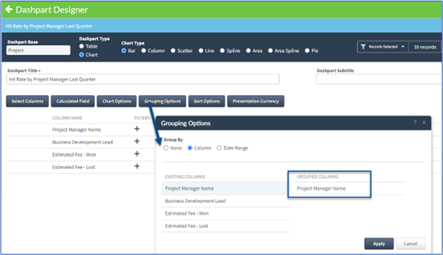
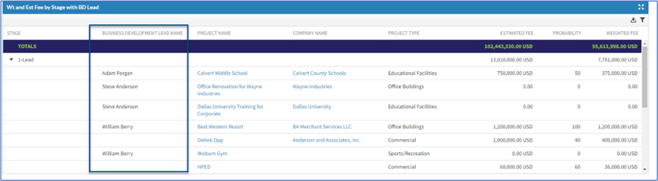
#4 Adjust Dashpart Grouping
Dashpart grouping is a way to consolidate, subtotal, and even grand total data within a dashpart. If a dashpart is grouping on a data point your firm doesn’t capture, such as BD Lead, it won’t be useful to you. Instead, change the filter to use a different field, such as Project Manager or Principal, and make the dashpart information more meaningful.
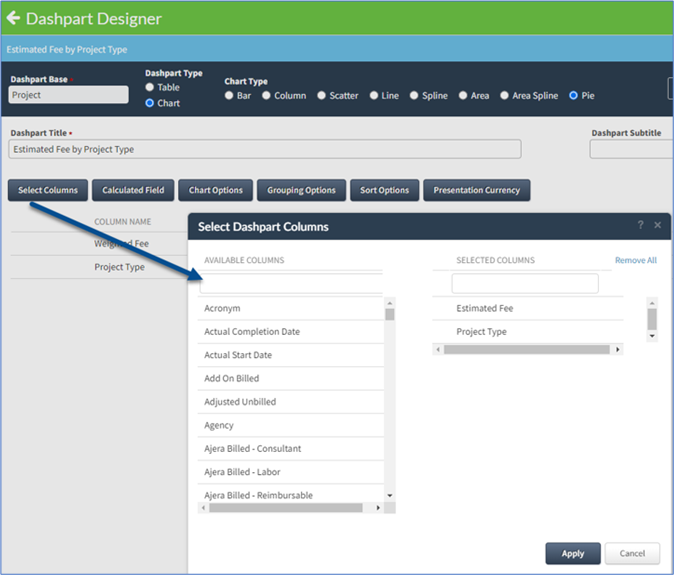
#5 Adjust Dashpart Columns
The biggest change users often make to dashparts is to change the columns on the dashpart. This is especially helpful for table dashparts where you can use list view filters to quickly filter the data in the table.
Our pre-defined dashparts on the BD Active Pursuits dashboard use the Weighted Fees value to show pursuits in a variety of ways. Some firms do not use the Probability field, so this dashboard doesn’t have much information. If that is the case for your firm, these dashparts can be copied and then adjusted to use Estimated Fees rather than Weighted Fees. You can also adjust the columns or calculations in the charts or tables to gain more targeted insight for your teams.
Want to Learn More?
If you’re just getting started and want help building the best CRM dashboards for your teams, let Deltek’s consultants help. Reach out to the Vantagepoint Consulting team or your Deltek partner to learn more.
You can also check out the Deltek Learning Zone for tips and tricks for better leveraging your dashboards.
Stay tuned for a future blog post that will explore additional configuration options for CRM and BD dashboards including calculated fields, user-defined fields and workflows and more to capture and display the right data for your business.
About the Author
As Sr. Principal Consultant at Deltek, Tracy Peets has spent the last 28 years working in the A&E software industry helping CRM and Proposals customers get the most out of their Deltek Vision and Deltek Vantagepoint solutions.
Deltek Project Nation Newsletter
Subscribe to receive the latest news and best practices across a range of relevant topics and industries.


