 Log In


Powerful Schedule Risk Assessment Outputs with Deltek Acumen


How Acumen Risk Turns Uncertainty into Action
In Part 1 of this blog series, we explored how Deltek Acumen Risk empowers project teams to model future uncertain events using tools like weather windows, delay penalties, probabilistic task existence, and more. Today, we will discuss what happens after the inputs are set. This is where Acumen’s simulation engine transforms input data into powerful insights used to support key decisions and drive successful project outcomes.
Acumen is powered by information in your project plan, risk and uncertainty inputs, and, optionally, its own Risk Adviser™ wisdom. The result? Not static charts, but dynamic decision support assets that help you prioritize threats, evaluate mitigation strategies, and communicate risk clearly.
The Risk Driver Tornado Chart
Zero in on the Risks That Matter Most
Your top project threats are your best candidates for targeted mitigation planning. The first step is understanding the threats and their expected magnitude of impact. Acumen’s engine identifies threats that may seem minor but can drive significant delays. Even risks with low probability or impact can disrupt key areas of the plan.
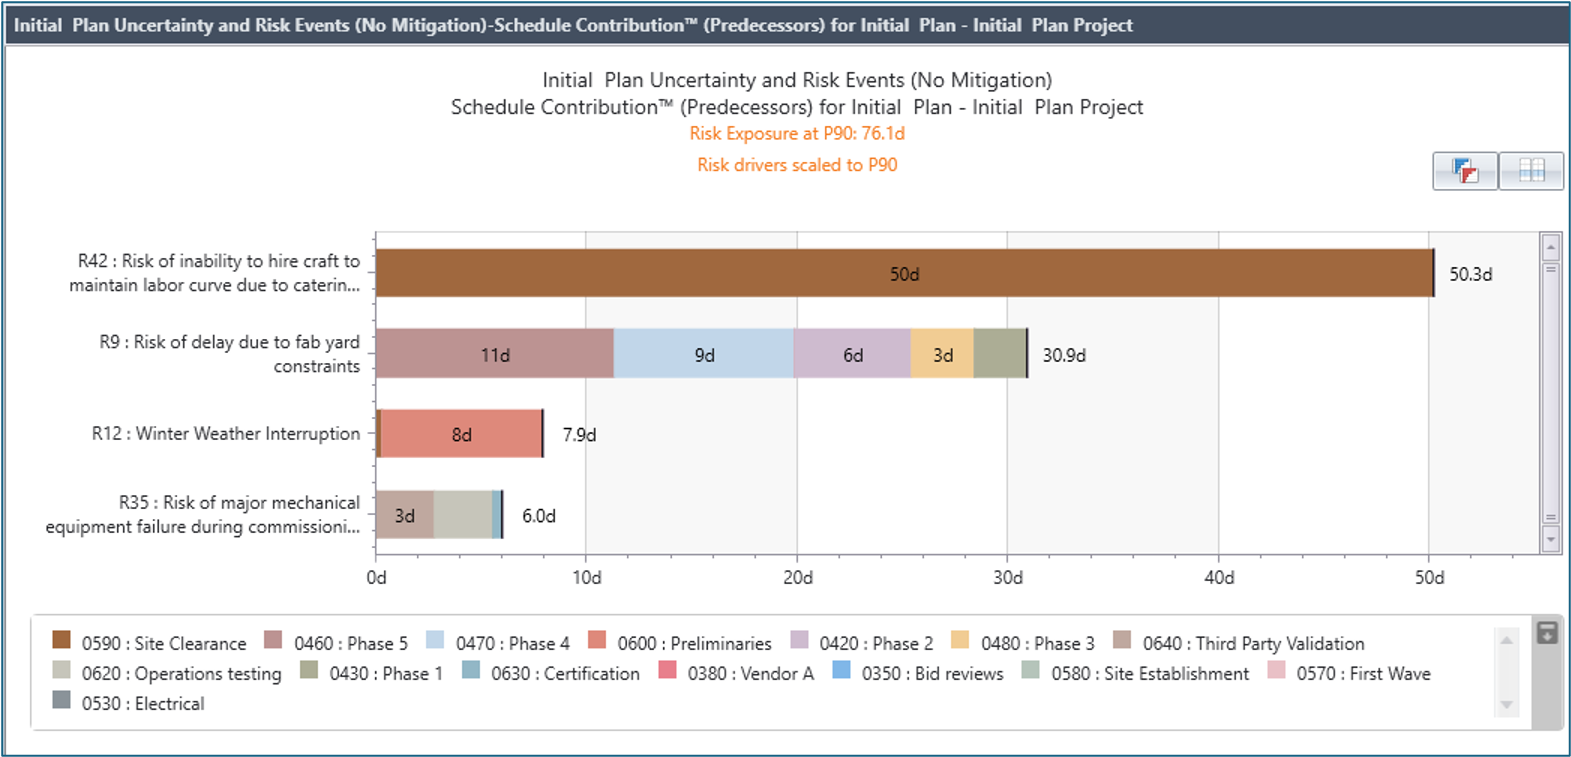
The Risk Drivers Tornado Chart ranks threats, displays expected delays, and highlights tasks directly impacted by risk.
The Risk Driver Tornado Chart provides four key advantages that help teams move from risk awareness to action:
- Clarity: Ranks risks by their impact on schedule or cost, making it easy to spot the most disruptive threats.
- Focus: Helps teams concentrate mitigation efforts where they matter most, rather than spreading resources too thin.
- Interactivity: Hover cursor over bars and segments in the chart to reveal contextual information about the threats to enable deeper clarity about focus areas.
- Closed-Loop Process: Test mitigation strategies using Acumen’s Risk Mitigation modeling features, reassess their impact in the Tornado Chart, and integrate approved strategies into the plan and forecast.
The Risk Driver Tornado Chart is a powerful tool for turning risk data into clear, actionable decisions that keep your project on track.
Mitigation Burn-Down Waterfall
From Reactive to Proactive Recovery Planning
Introduced in the Modeling Real-World Risk with Deltek Acumen blog, the Mitigation Burn-Down Waterfall improves recovery planning by transforming the exercise from reactive to proactive. It helps teams make smarter decisions about mitigation resources.
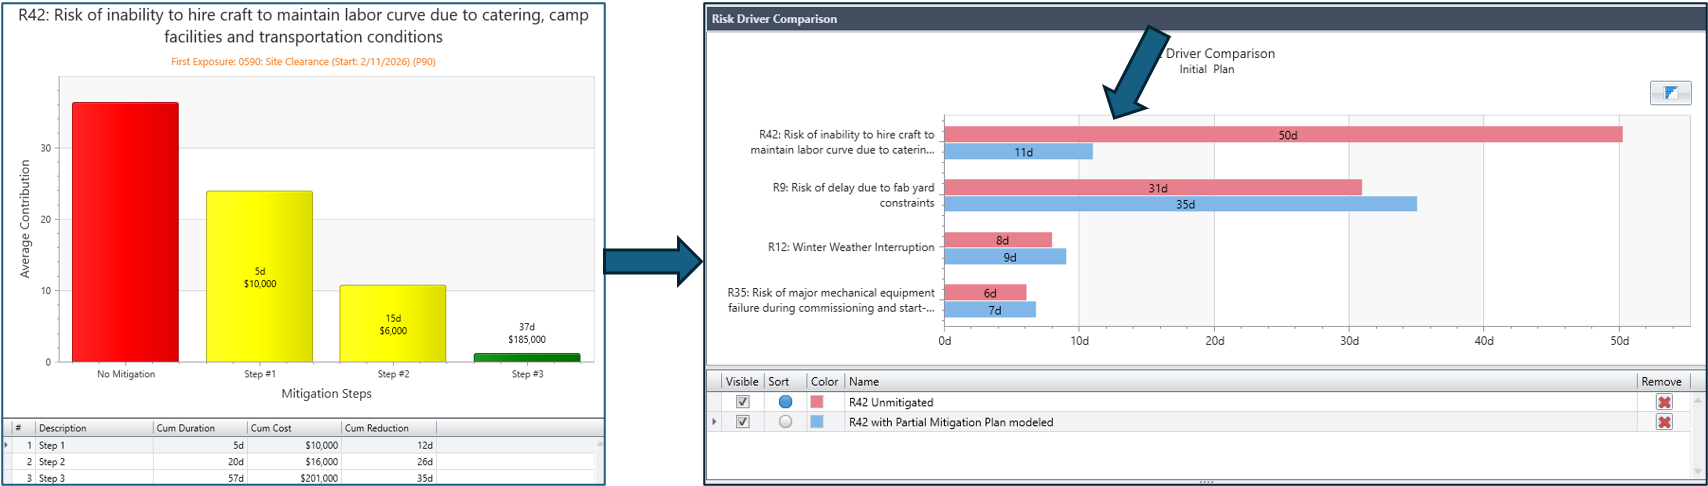
Mitigation Steps (left) lead to a favorable Tornado Chart Comparison view (right) for this top project threat.
The Mitigation Burn-Down Waterfall provides teams with benefits such as:
- Efficiency: Highlights which mitigation steps deliver the greatest recovery for the least cost.
- Cost Control: Enables smarter use of reserves by targeting only the most impactful threats.
- Communication: Provides clear direction for stakeholders on how risks are controlled and mitigated. When contingency is utilized, the rationale and projected outcomes are clear and justifiable.
This visualization helps teams justify decisions, allocate resources wisely, and communicate with clarity.
Risk Exposure Histogram
Know Your Confidence Level in Project Delivery
While the Tornado Chart and Burn-Down Waterfall target key threats, activities, and mitigation steps, the Risk Exposure Histogram provides a high-level view of your project’s Risk Picture. It shows how confident you can be in meeting project delivery targets.
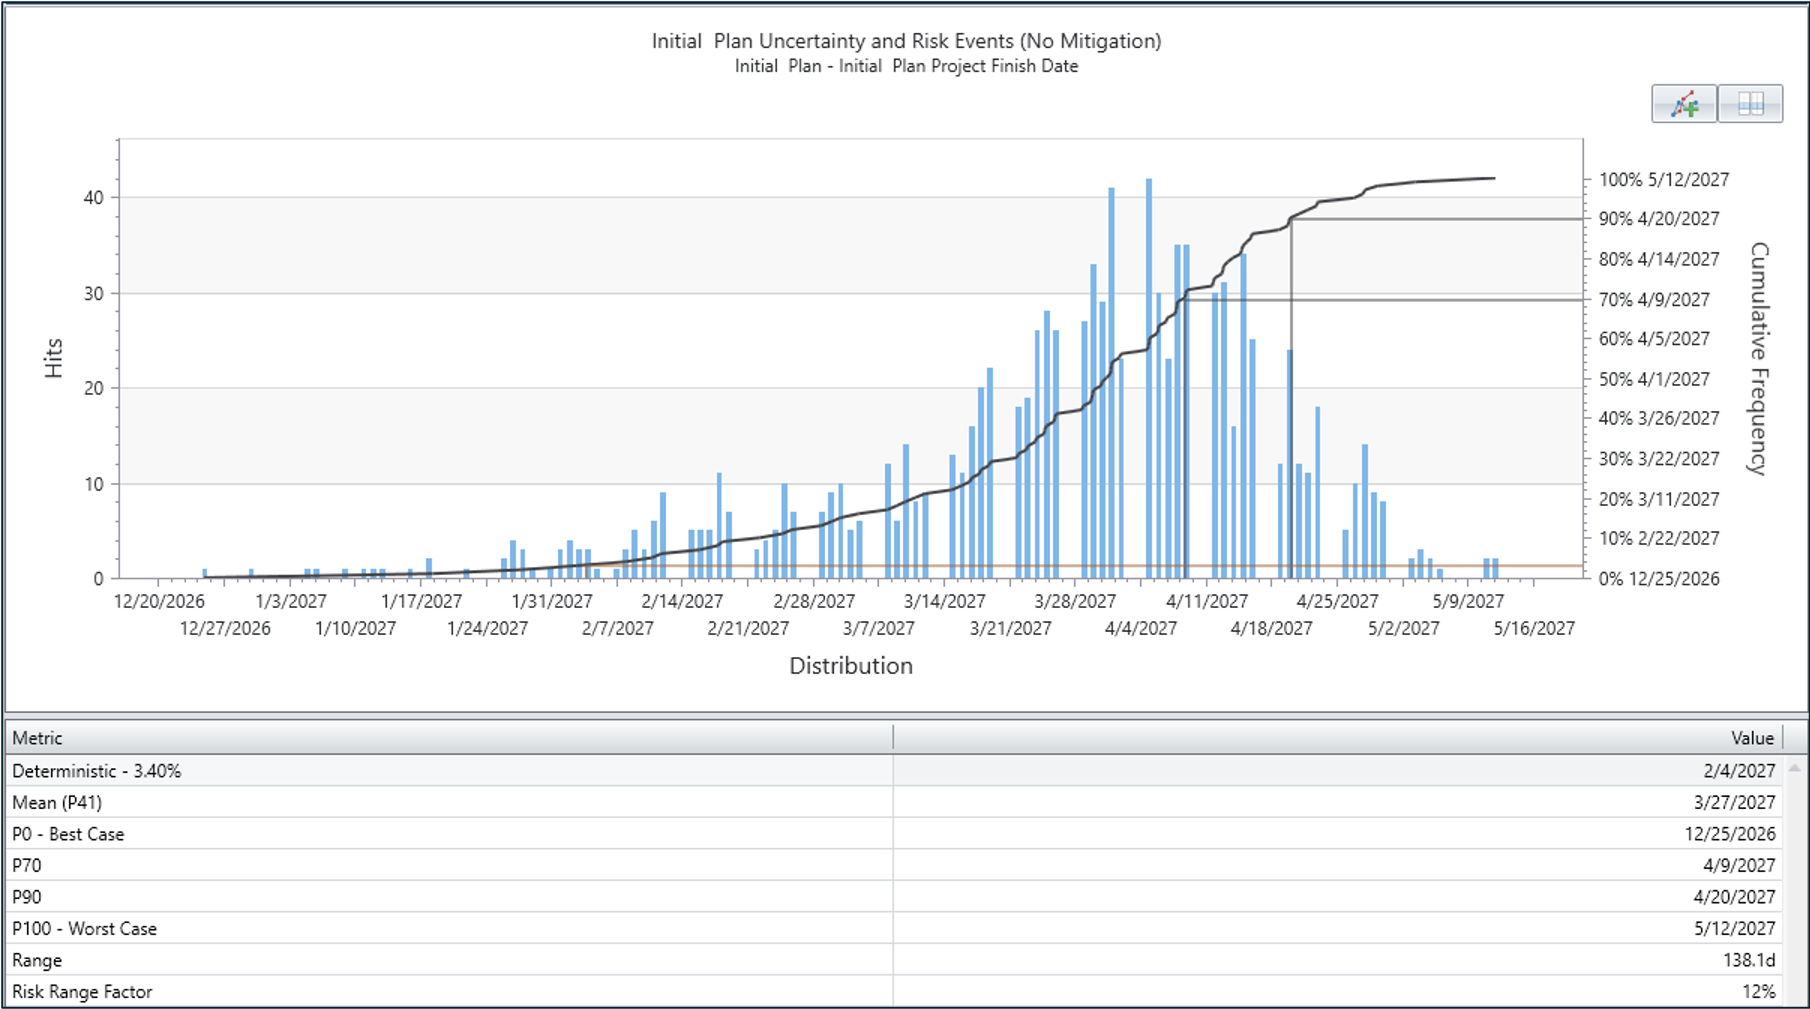
The Risk Exposure Histogram is a statistical report used to assess risky situations.
From a technical standpoint, this chart is a pareto analysis of the various outputs of Acumen’s Monte Carlo simulation. From a practical perspective, it helps you to understand the confidence you have that the project will meet its expected delivery timeframe.
In the histogram chart above, the deterministic percent means that the current schedule finish date of 02/4/2027 was met in only 3.4% of simulated outcomes. The P90 (probability value) date of 04/20/2027 means that 90% of the simulated outcomes finished on or before this date.
This example underscores how the Risk Exposure Histogram reveals the gap between planned and probable delivery dates, highlighting that the current schedule is overly optimistic and unlikely to be met without intervention. By visualizing this misalignment, teams can proactively adjust timelines, communicate realistic expectations, and prioritize mitigation strategies.
You may choose to include the Risk Exposure Histogram in a briefing depending on your audience’s comfort with statistical analysis. But when used, it provides a clear, data-backed view of schedule confidence.
Why It Matters
Acumen Risk Helps You Deliver Projects with Confidence
Acumen Risk drives successful project outcomes by providing clarity, control, and confidence via visual resources such as the Tornado Chart, Mitigation Burn-Down, Comparison Views, and the Risk Exposure Histogram.
By combining simulation outputs with visuals and mitigation modeling, project teams can:
- Identify and prioritize the risks that matter
- Build smarter mitigation strategies
- Communicate risk clearly
- Increase confidence in delivery timelines
Understanding, analyzing, and handling threats are key ingredients to successful project delivery. Acumen Risk provides you the tools and insights to do it right.
Q4 Deltek PPM Solutions Customer Town Hall
Learn about the most recent Acumen release from product experts.
Related Articles

Deltek Project Nation Newsletter
Subscribe to receive the latest news and best practices across a range of relevant topics and industries.


