Visualize Project Data with Executive Dashboards and Business Intelligence

Are you able to visualize your data and get all the information you need about your projects? Can you capture the necessary information and answer critical business questions quickly and accurately?
To achieve project success, it is imperative that organizations are not limited by their business intelligence capabilities and that users and executives have access to data, anytime, anywhere.
The Power of Executive Dashboards
It is now easier than ever to securely create and share actionable data using the enhanced capabilities of Costpoint Enterprise Reporting (CER) v. 7.2.3. This latest version allows you to easily create dashboards by pulling in the Costpoint data you want, in the format you want, with a variety of filters you want. Now your executive dashboards can be configured to specific informational needs, providing a visual of actionable data with drill-down-to-the-details capabilities.
With CER 7.2.3, users have the ability to run reports by the owning organization, project type, profit by project, and project manager, all through a single dashboard in just a few clicks.
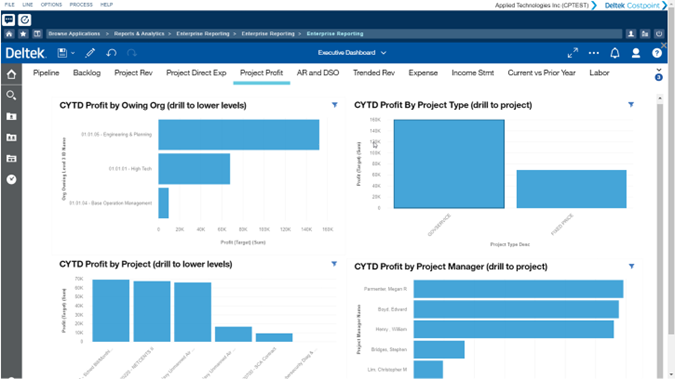
CER 7.2.3’s Executive Dashboards have drill down capabilities for access to the data making up the dashboard. Additionally, users can create and add their own navigation paths, simply by dragging and dropping projects onto the dashboard, for access to more information than ever before, right at their fingertips.
Easily Create Your Dashboard
The flexibility of the Executive Dashboard not only provides ease and creativity to reporting, it also enhances the project management process. With CER 7.2.3’s dashboards, users can more accurately monitor their projects and profitability, with minimal effort.
One of the great features of v. 7.2.3 is the ability to see tasks associated with individual projects – breaking down the bill rates and costs, which helps users determine the potential root of the problem (i.e. overflow in spending) so the issue can be addressed as quickly as possible.
Additionally, users can customize their project reports with various visualization options to best fit their needs at that time. For example, if one prefers conducting project analysis through bar charts, users can drag and drop the bar chart image into their dashboard and customize with their preferred project reports (i.e. project actual amount, period load target amount, and period revenue amount). Users can also show the project value numbers through visualization properties and calculate the average cost rate of a particular employee.
Real-time Project Analysis
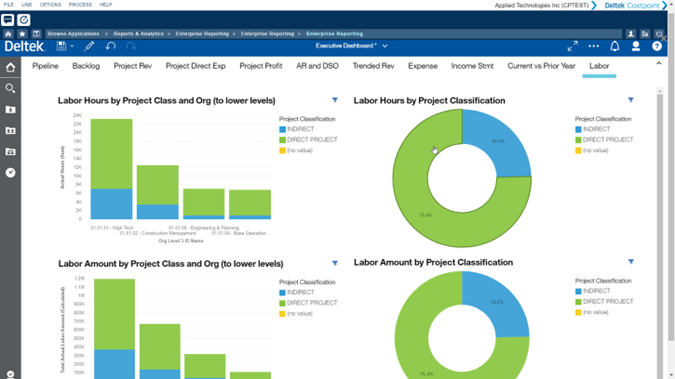
CER v. 7.2.3 gives users the capability to view their data in real-time, for a more accurate project analysis. Using the new enhanced version, users can set their dashboard to “relative time” to reveal the current period, without having to tell the system (i.e. Fiscal Year End) – for an improved, more intuitive user experience. The relative time setting shows users where people are working, along with the project classification to see where employees are spending the majority of their time and in what department. This helps control direct and indirect costs within an organization.
Now What?
Check out Deltek Principal Solutions Engineer, Justin Sommer’s webinar, Designing Dashboards for Powerful Project Analysis, to see how CER v. 7.2.3 can help transform your business to power project success.
Quickly answer questions and gain actionable insight into your data by upgrading to CER v. 7.2.3. Contact your account representative or Deltek Customer Care for more information.
Deltek Project Nation Newsletter
Subscribe to receive the latest news and best practices across a range of relevant topics and industries.