Take Your Vantagepoint CRM and Business Development Dashboards to the Next Level

At Deltek ProjectCon, I delivered a session on Deltek Vantagepoint CRM & Business Development (BD) dashboards. In the session, attendees learned tips and tricks for adjusting copies of the pre-defined CRM and BD dashboards available in Vantagepoint.
In a previous post, I highlighted how simple modifications can create more impactful dashboards. In this post, we’ll focus on how you can take your Vantagepoint CRM dashboards to the next level with configuration options like calculated and user-defined fields and workflows.
Deltek Vantagepoint CRM
Not using Vantagepoint CRM yet? Learn about the benefits today.
CRM & Business Development Pre-Defined Dashboards
If you haven’t done so already, it’s helpful to spend some time exploring and working with the pre-defined dashboards already available. These are the three that are focused on CRM and business development:
When reviewing the pre-defined dashboards, consider the following:
- What dashparts work for your firm and the data you currently capture?
- Is there something different you’d like to see? Are you capturing the data to see or use it on a dashpart?
- You may find you can rearrange or combine different dashparts onto a new dashboard to better fit your needs or that you want to build your own dashparts.
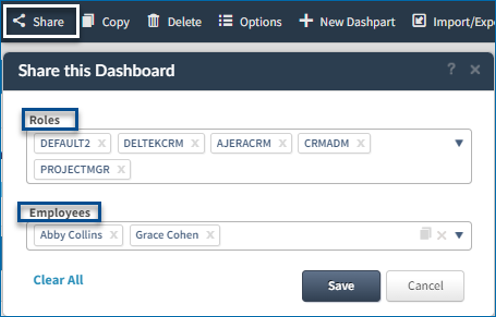
If you do not have access to the pre-defined dashboards, your System Administrator can share them with your role or with you individually.
Create Dashparts for CRM & BD Metrics
Business development and marketing teams often produce monthly, quarterly and annual reports that include BD metrics. Instead of running or sending reports to key team members, Vantagepoint dashparts can be set up to display the same metrics. A key to creating meaningful dashparts is to capture the needed data quickly and easily. The method described below can eliminate the need to export pursuit data monthly to Microsoft Excel to track the dates for each pursuit stage.
User-defined fields can be created and populated via Vantagepoint workflows to track the pursuit lifecycle for each pursuit. For example, fields can be created to track when a pursuit enters each active pipeline stage. The Won/Lost Date would then be used to track when the pursuit lifecycle ended and it either became awarded, lost, cancelled or the firm decided not to pursue the project.
The workflows to capture the stage change dates are simple and can be set up to capture data for both new pursuit projects and existing pursuits when the pipeline stage changes. The column-change actions set an overall stage change date and a stage change date for each pipeline stage to the current date that the pursuit entered that stage. The action condition indicates which stage change date to populate in Vantagepoint based on the current stage.


Hint: Create the INSERT workflow event first and then copy it to make the CHANGE workflow event. Then, just change the CHANGE event condition to include Stage has changed.


Once you are capturing these pursuit lifecycle dates, you can use them in dashparts to produce CRM and BD metrics. Here is an example of a dashpart showing proposals submitted each month this year.

Each bar represents a month and shows the count of proposals submitted during that month. This example uses the Proposal Stage Date field, but it could also use a Proposal or Submittal Due Date field.
The chart dashpart is created using a Project base and a series of calculated fields.

Let’s dig into the details.
First, use the dashpart record selection to isolate the data to the current year, such as Stage Date for Proposal Stage Year is the current year. To help with space, the labels can be rotated using Chart Options.


Next, configure each monthly calculated fields. If you do a lot of calculated fields, it is helpful to name them in a way that groups like fields together.

Another way to save space is to adjust the properties of each column to abbreviate the month and year. In this example, “Display Values on Chart” is turned on so users do not have to hover over or click on a column to see the data.

The calculation for each month is constructed in the same manner with a slight change in the number of each month. By using a Case Statement and the DatePart() function, it is easy to count the number of pursuit records that match the month in the calculation. In this example for January, the case statement does the following: if the month of the proposal stage date is January, count the record; otherwise, do not count it. Remember, the dashpart record selection has already filtered the pursuits to only those that had a proposal stage date in the current year.


After setting up all 12 months’ calculated fields, they can be added to the dashpart.

Keeping with this same theme, you could also create a dashpart that looks at numbers of pursuits that were in each stage in a time period, such as current quarter. The concept is the same and the calculations are similar.

This dashpart includes two kinds of metrics. The first is a count of all records in the record selection. The second is counts for pursuits that are in the noted stages. Let’s look at the details.

First, set the record selection to isolate the dashpart to just the project records you want to use on the dashpart as shown in the screenshot. In this example, it is set to the stage changed in quarter and the won/lost date is in quarter. For the chart options, you can leave the default settings as shown below.


The first column of the dashpart, Total Changed Stages CQ, represents the projects that have changed stages in the current quarter. This is shown as a simple count of records within the record selection. The Count is a calculated field with a simple expression of a 1 (one). Each record will count as one value and the values are summed up based on the grouping.

The Count calculated column is renamed to clarify what it represents. For the Total Changed Stages, you can edit the properties to set the correct heading, check the box that you want to display the values on the chart and select the color you want for this bar in the chart.

The next step is to set up a series of calculated fields for each Pipeline Stage Date count or Won/Lost Date count. These should all be set up with the same basic formula and remember to set up the names of the fields so they can be easily identified and grouped together. Also be sure to reference the correct stage date or won/lost date.

The calculation is very similar to the monthly proposals count, but it uses the Pipeline Stage Dates or Won/Lost Date and the GetDate() function to ensure the date is within the current quarter before including it in the count for that Pipeline Stage Date. For each stage, you will need to set up the calculation as shown below. Select the date value from the list of fields and use a Case Statement when this is true...then use this value...else use this value. To isolate the quarter part of the date, use the DATEPART() function. You will also want to use the GETDATE() function to specifically pull today’s date in the calculation.

To make this dashpart work effectively, you will also need to set up the calculation to count based on the won/lost date. For this calculation, select the Won/Lost Date value from the list of fields. Then, use the calculation case statement below where you will use DatePart() and GetDate(). You will also need to include [:StageStep] = ‘W’ or ‘L’ or ‘D’ to ensure you get the specific data you need. Keep reading for an explanation of these stage steps.

There are two ways to approach the counting of Wins, Losses, and projects that are either not pursued or cancelled – groups of stages or individual stages.
Grouping Pursuit Stages
One is to group the three different end-pursuit stages into their stage step of W for Wins, L for Losses, and D for No-Go or Cancelled.
By Stage Steps:
- Won: Case when datepart(q,[:w1WonLostDate])=datepart(q, getdate()) and [:StageStep] = 'W' then 1 else 0 end
- Lost: Case when datepart(q,[:w1WonLostDate])=datepart(q, getdate()) and [:StageStep] = 'L' then 1 else 0 end
- Do Not Pursue: Case when datepart(q,[:w1WonLostDate])=datepart(q, getdate()) and [:StageStep] = 'D' then 1 else 0 end

Calculating Individual Pursuit Stages
The second option is to separate the pursuit metrics by individual end-pursuit stage (be sure to use the Stage Description rather than the Stage Code in the calculation).


For example, here is the calculation for the No-Go stage:
- Case when datepart(q,[:w1WonLostDate]) = datepart(q, getdate()) and [:w1Stage] = '6-No Go' then 1 else 0 end
The finished dashpart shows the number of projects that moved within the Pipeline and the number of projects that were in each stage, or stage step, in the given timeframe. It should be noted that in this example, the left column, Total Changed Stages CQ, with a total of 11 does not equal the total of all the other columns. This is because a pursuit or project may have moved into multiple stages within the quarter.

Explore the CRM and BD pre-defined dashboard and then get creative and make your own dashparts.
Want to Learn More?
If you are just getting started and want help building the best CRM dashboards for your teams, let our consultants help. Reach out to the Vantagepoint Consulting team or your Deltek partner to learn more. You can also check out the Deltek Learning Zone for tips and tricks for better leveraging your dashboards.

About the Author
As Sr. Principal Consultant at Deltek, Tracy Peets has spent the last 28 years working in the A&E software industry helping CRM and Proposals customers get the most out of their Vision and Vantagepoint solutions.
Related Articles

Deltek Project Nation Newsletter
Subscribe to receive the latest news and best practices across a range of relevant topics and industries.